 云计算服务
云计算服务
 服务器租用
服务器租用
 DDOS 防护
 虚拟主机
虚拟主机
 域名服务
域名服务
 基础设施
基础设施
 关于我们
关于我们

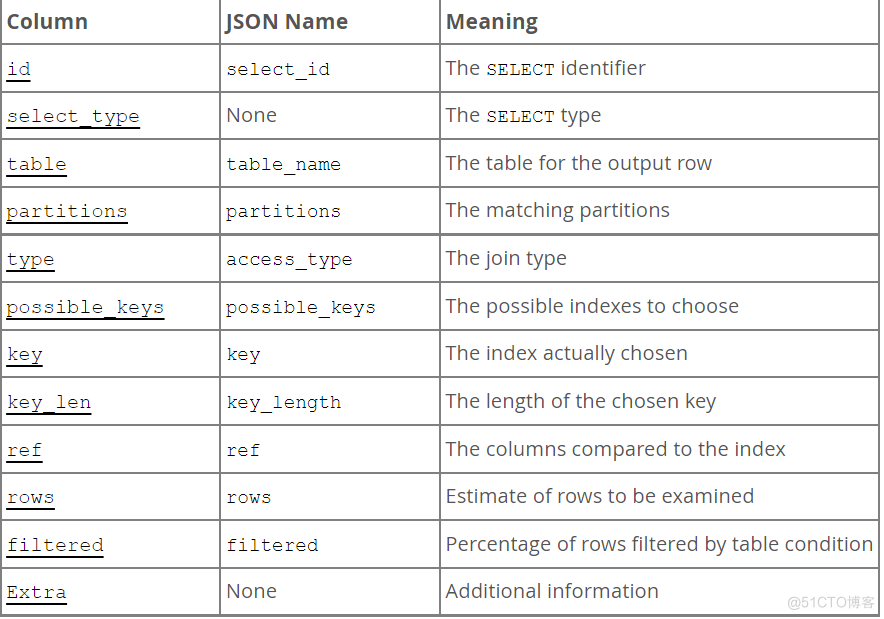
MySQL8.0提供了多种查看执行计划的方式,接下来我们一起学习一下。
传统方式mysql> explain select * from sbtest1 where k=5014614 \G
*************************** 1. row ***************************
id: 1
select_type: SIMPLE
table: sbtest1
partitions: NULL
type: ref
possible_keys: k_1
key: k_1
key_len: 4
ref: const
rows: 89
filtered: 100.00
Extra: NULL
1 row in set, 1 warning (0.01 sec)
输出信息如下:
mysql> explain select * from sbtest1 where k=5014614 \G
*************************** 1. row ***************************
           id: 1
  select_type: SIMPLE
        table: sbtest1
   partitions: NULL
         type: ref
possible_keys: k_1
          key: k_1
      key_len: 4
          ref: const
         rows: 89
     filtered: 100.00
        Extra: NULL
1 row in set, 1 warning (0.01 sec)
mysql> explain format = json select * from sbtest1 where k=5014614 \G
*************************** 1. row ***************************
EXPLAIN: {
"query_block": {
"select_id": 1,
"cost_info": {
"query_cost": "31.15"
},
"table": {
"table_name": "sbtest1",
"access_type": "ref",
"possible_keys": [
"k_1"
],
"key": "k_1",
"used_key_parts": [
"k"
],
"key_length": "4",
"ref": [
"const"
],
"rows_examined_per_scan": 89,
"rows_produced_per_join": 89,
"filtered": "100.00",
"cost_info": {
"read_cost": "22.25",
"eval_cost": "8.90",
"prefix_cost": "31.15",
"data_read_per_join": "63K"
},
"used_columns": [
"id",
"k",
"c",
"pad"
]
}
}
}
输出信息大体和传统方式相同,增加了query_cost等信息。
图形方式MySQL Workbench可以图形展示,此处不做过多展示。
树形方式mysql> explain format = tree select * from sbtest1 where k=5014614 \G
*************************** 1. row ***************************
EXPLAIN: -> Index lookup on sbtest1 using k_1 (k=5014614) (cost=31.15 rows=89)
mysql> explain format = tree select * from sbtest1 where k in (select k from sbtest2 where id > 100000 and id < 100010) \G
*************************** 1. row ***************************
EXPLAIN: -> Nested loop inner join  (cost=23.15 rows=50)
    -> Table scan on <subquery2>  (cost=0.29..2.61 rows=9)
        -> Materialize with deduplication  (cost=3.25..5.57 rows=9)
            -> Filter: ((sbtest2.id > 100000) and (sbtest2.id < 100010))  (cost=2.06 rows=9)
                -> Index range scan on sbtest2 using PRIMARY  (cost=2.06 rows=9)
    -> Index lookup on sbtest1 using k_1 (k=`<subquery2>`.k)  (cost=13.11 rows=6)
更清楚明了的展示查询过程,以及性能消耗。
EXPLAIN ANALYZEmysql> explain analyze select * from sbtest1 where k in (select k from sbtest2 where id > 100000 and id < 100010) \G
*************************** 1. row ***************************
EXPLAIN: -> Nested loop inner join (cost=23.15 rows=50) (actual time=0.178..5.203 rows=553 loops=1)
-> Table scan on <subquery2> (cost=0.29..2.61 rows=9) (actual time=0.001..0.005 rows=9 loops=1)
-> Materialize with deduplication (cost=3.25..5.57 rows=9) (actual time=0.066..0.072 rows=9 loops=1)
-> Filter: ((sbtest2.id > 100000) and (sbtest2.id < 100010)) (cost=2.06 rows=9) (actual time=0.038..0.045 rows=9 loops=1)
-> Index range scan on sbtest2 using PRIMARY (cost=2.06 rows=9) (actual time=0.034..0.039 rows=9 loops=1)
-> Index lookup on sbtest1 using k_1 (k=`<subquery2>`.k) (cost=13.11 rows=6) (actual time=0.071..0.558 rows=61 loops=9)
增加了如下4个实际度量:
获取第一行的实际时间(ms),是actual time中的第一个时间。 获取所有行的实际时间(ms),是actual time中的第二个时间。 实际读取的行数,是actual time后边的rows。 实际循环的行数,是actual time后边的loops。 EXPLAIN FOR CONNECTION实际工作中,遇到正在执行且执行了很长时间的SQL,查看执行几乎一般直接explain + SQL查看执行计划。但是受统计信息等因素影响,可能看到的执行计划并不准确,所以建议使用如下方法进行查询。
mysql> select * from information_schema.innodb_trx \G
*************************** 1. row ***************************
                    trx_id: 421317349658008
                 trx_state: RUNNING
               trx_started: 2022-09-05 16:54:46
     trx_requested_lock_id: NULL
          trx_wait_started: NULL
                trx_weight: 0
       trx_mysql_thread_id: 70
                 trx_query: select * from sbtest1 where pad like '%22195207048%'
       trx_operation_state: NULL
         trx_tables_in_use: 1
         trx_tables_locked: 0
          trx_lock_structs: 0
     trx_lock_memory_bytes: 1136
           trx_rows_locked: 0
         trx_rows_modified: 0
   trx_concurrency_tickets: 4062
       trx_isolation_level: REPEATABLE READ
         trx_unique_checks: 1
    trx_foreign_key_checks: 1
trx_last_foreign_key_error: NULL
 trx_adaptive_hash_latched: 0
 trx_adaptive_hash_timeout: 0
          trx_is_read_only: 1
trx_autocommit_non_locking: 1
       trx_schedule_weight: NULL
1 row in set (0.00 sec)
查到SQL_ID是70。然后查看该ID的执行计划。
mysql> explain for connection 70 \G
*************************** 1. row ***************************
           id: 1
  select_type: SIMPLE
        table: sbtest1
   partitions: NULL
         type: ALL
possible_keys: NULL
          key: NULL
      key_len: NULL
          ref: NULL
         rows: 9867765
     filtered: 100.00
        Extra: Using where


.png)

.png)

