 云计算服务
云计算服务
 服务器租用
服务器租用
 DDOS 防护
 虚拟主机
虚拟主机
 域名服务
域名服务
 基础设施
基础设施
 关于我们
关于我们
从回归模型诊断的角度对统计数据中的异常值进行探测与分析,并基于Matlab语言,结合具体实例,给出回归诊断在统计数据异常值探测中的应用.
2 部分代码function outliers_demo(N,f)
% Demo of 'DetectMultiVarOuliers' for 2D normally distributed data with

% outliers.
%
% OPTIONS:
% - N : number of random samples. N=1E3 is default.
% - f : real number between (0 and 0.5) indicating the fraction of
% outliers. f=0.05 is the default setting.
if nargin<1 || isempty(N), N=1E3; end
if nargin<2 || isempty(f), f=0.05; end
% Generate a random normally distributed dataset with outliers
% -------------------------------------------------------------------------
% Random covariance matrix
t=rand(1)*pi;
U=[cos(t) -sin(t);sin(t) cos(t)];
Co=U*diag(rand(1,2))*U';
% Random samples
N=round(max(N,10));
X=mvnrnd([0 0],repmat(Co,[1 1 N]));
% Replace round(f*N) samples with uniformly distributed outliers
r=1.5*norm(max(X));
f=min(0.5,f);
M=round(f*N);
chi_crt=chi2inv(0.99,2);
cnt=0; k=0;
X_out=cell(1);
while cnt<M
% random sample
x=randn(N,2);
x=bsxfun(@rdivide,x,sqrt(sum(x.^2,2)));
x=bsxfun(@times,r*sqrt(rand(N,1)),x);
% check for outlyingness
MD=sum(x'.*(Co\x')); % Mahalanobis distance (squared)
chk=MD>chi_crt;
if sum(chk)==0, continue; end
k=k+1;
cnt=cnt+sum(chk);
X_out{k}=x(chk,:);
end
X_out=cell2mat(X_out);
X_out=X_out(1:M,:);
X(1:M,:)=X_out;
% Note that outliers were placed at the beginning of the data matrix so that
% they are easy to keep track of, however, we do not supply this prior
% knowledge to the 'DetectMultiVarOuliers' function so it doesn't know
% which of the samples are outliers.
% Now attempt to find the outliers using 'DetectMultVarOutliers' function
% -------------------------------------------------------------------------
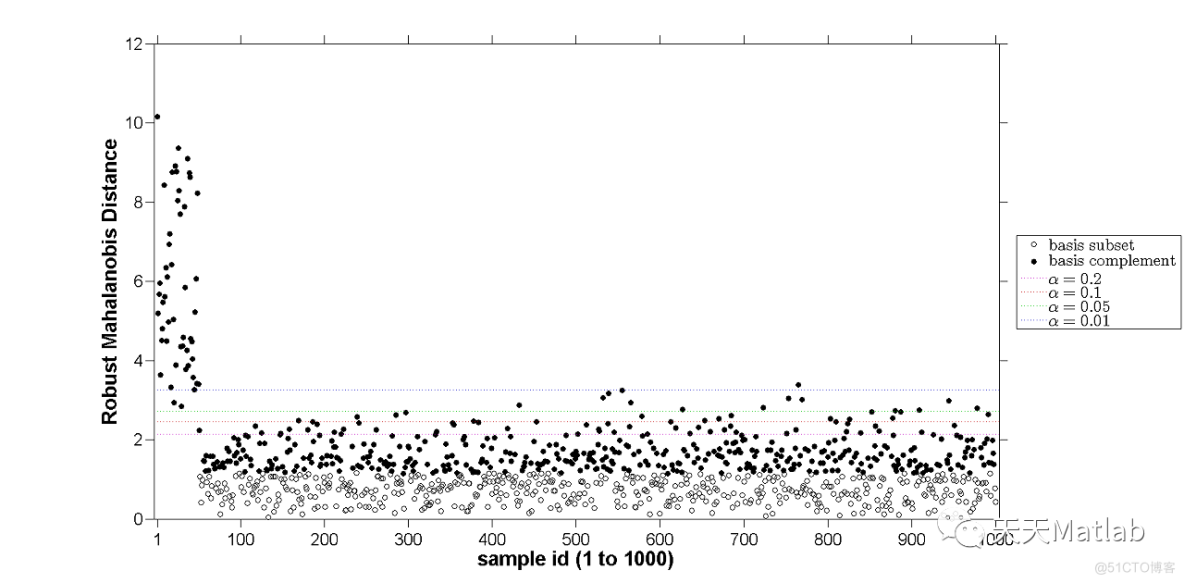
[mu,S,RD,chi_crt]=DetectMultVarOutliers(X);
% Note that the function automatically plots robust Mahalanobis distance (RD)
% vs sample index. In this plot, "basis subset" denotes the samples in X
% that were used to obtain robust estimates of covariance (S) and mean (mu).
% In this simulation, outliers are the samples with RD greater than critical
% values of chi^2 distribution. However, there may be situations where this
% is not the case. For this reason, tests for outlyingness based on RD
% should always be confirmed visually. See documentation of
% 'DetectMultVarOutliers' for additional information.
% To improve detection accuracy you can supply an estimate of the number of
% outliers in X (n_out) as [...]=DetectMultVarOutliers(X,n_out)
% Plot simulated data and estimated parameters
% -------------------------------------------------------------------------
hf1=gcf;
hf2=figure('color','w');
pause(0.1)
warning('off','MATLAB:HandleGraphics:ObsoletedProperty:JavaFrame');
j_hf=get(hf2,'JavaFrame');
j_hf.setMaximized(true);
warning('on','MATLAB:HandleGraphics:ObsoletedProperty:JavaFrame');
drawnow
pause(0.1)
axis equal
hold on
x_min=min(X);
x_max=max(X);
d=x_max-x_min;
XLim=[x_min(1)-0.04*d(1) x_max(1)+0.04*d(1)];
YLim=[x_min(2)-0.04*d(2) x_max(2)+0.04*d(2)];
set(gca,'box','on','XLim',XLim,'YLim',YLim)
% N-M samples designed as inliers
h1=scatter(X((M+1):end,1),X((M+1):end,2),'b','MarkerFaceColor','b','SizeData',30);
% M simulated outliers
h2=scatter(X_out(:,1),X_out(:,2),'r','MarkerFaceColor','r','SizeData',30);
% Samples with RD greater than critical value of chi^2 for alpha=0.01/2
id_out=RD>chi_crt(4);
h3=scatter(X(id_out,1),X(id_out,2),'w','MarkerFaceColor','none','MarkerEdgeColor','k','SizeData',100);
h=legend([h1 h2 h3],{'normally distributed samples' 'simulated outliers' 'potential outliers'});
set(h,'FontSize',20,'Location','EastOutside')
pause(0.5)
figure(hf1)

[1]潘丽静. 基于Matlab语言的统计数据异常值检验[J]. 赤峰学院学报:自然科学版, 2012(21):2.
[2] Hadi, A.S., 1992. Identifying multiple outliers in multivariate data. Journal of the Royal Statistical Society. Series B (Methodological), Vol. 54(3), pp. 761-771.
[3]Weiszfeld, E., 1937. Sur le point par lequel la somme des distances den points donnés est minimum. Tohoku Mathematics Journal, Vol. 43, pp. 355–386.
部分理论引用网络文献,若有侵权联系博主删除。


.png)

.png)

